How Much Organic Growth Can You Really Put in Your SaaS Forecast?
Paid acquisition has a tidy story in a spreadsheet. Organic and owned traffic rarely does — here is how to model it without a single optimistic line that falls apart in month three.
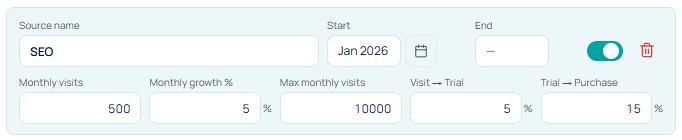
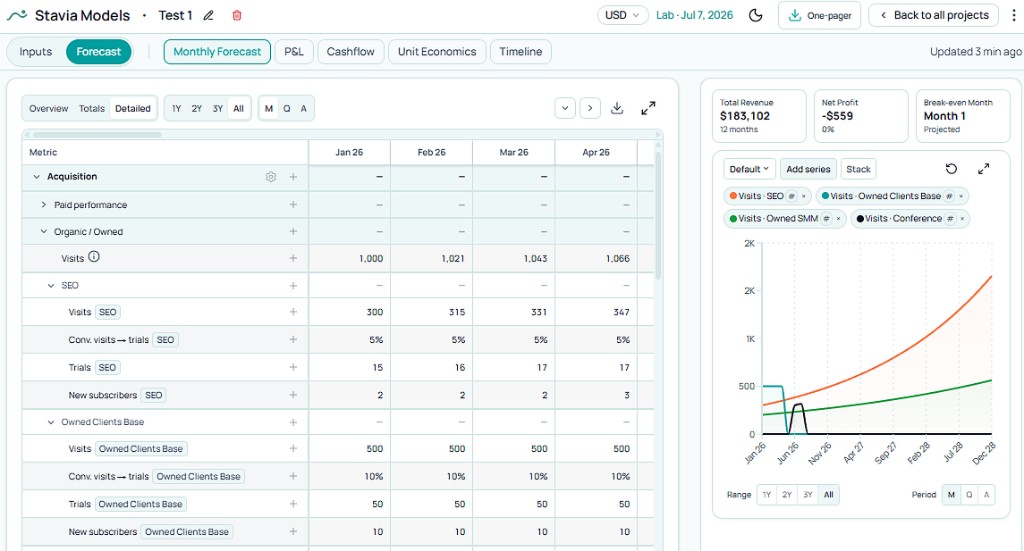
Model one organic source
Adjust traffic, growth, and conversion to see the monthly effect over 12 months.
Monthly values in the final month
Most founders are comfortable with paid acquisition in a model. You put in budget, clicks, conversion, and CAC starts to take shape.
Organic is where the story usually gets slippery.
A team knows it should be there. Investors want to see that the business is not fully dependent on paid channels. Founders also know that some of the best early users often come from content, warm networks, communities, founder-led distribution, or an audience they already have. But once they start filling in the model, "organic" often turns into one optimistic traffic line with no real logic behind it.
That is where forecasts start drifting away from reality.
The better way to handle it is more grounded: treat organic and owned acquisition as a small set of real sources, give each one its own traffic shape and conversion quality, and keep the assumptions conservative enough that you would still believe them six months from now.
One more thing matters now that did not matter in quite the same way a few years ago. Organic discovery is not only classic search rankings. People still search the way they always have, but they also run into products through AI-assisted search and answer-style experiences. Google documents how AI features can appear in Search, and OpenAI has described how ChatGPT can surface the web when people ask questions. This article is not a GEO playbook — but when you label a line "organic" in a forecast, it helps to remember that traffic can arrive through more surfaces than a single SERP story.
For how this block sits next to paid, partners, and referral, How to Model Acquisition Channels for Self-Serve SaaS walks through the full channel picture.
Why founders overestimate organic
When non-paid traffic finally moves, it usually means something real: clearer positioning, content that resonates, word of mouth, or an audience that is starting to trust you. It is tempting to read that as permission to draw a steep curve in the spreadsheet.
Search, in particular, rewards patience. Google's own guidance for site owners emphasizes that meaningful change in visibility often unfolds over weeks or months, not days. Independent studies of large page corpora tell a humbling story in the same direction: most pages never earn meaningful search traffic, and strong rankings for new URLs are the exception, not the default. None of that means SEO is a dead end. It means the first year of a startup site is a poor place for heroic traffic assumptions unless you already bring authority or distribution with you.
The same tension shows up outside search. A LinkedIn following, a newsletter list, a dormant CRM, or a community you are active in can absolutely feed the funnel — but turning that into a monthly visit number you would defend in a board meeting is harder than it looks.
I care less about precision here than about judgment: numbers you can still stand behind after a quarter of real operating data.
Background reading: How Search works (Google) · Ahrefs on pages and search traffic · Ahrefs on time to rank
What actually belongs in this part of the model
In Stavia, the Organic / Owned block is where I put non-paid traffic that still behaves like acquisition: someone lands on the site, and the funnel does the rest. Practically, that tends to be:
- SEO and content
- newsletter clicks
- outreach to an existing client base or CRM
- founder audience traffic — LinkedIn, X, a community you are in, a Slack group, a podcast you are on
- launch- or event-driven spikes that are not paid media
The mistake is blending all of that into one aggregate. SEO compounds on a different clock than a three-month CRM push. A conference spike should not live on the same row as evergreen content. When you separate them, the forecast starts to reflect how your go-to-market actually works.
Think in source types, not in one traffic line
Early-stage models stay readable when you group sources by how they behave over time, not by buzzwords on a marketing slide.
Compounding sources
Small at first, with room to grow: SEO, deep content, templates, tools, comparison pages, education hubs.
Steady owned reach
You keep showing up in front of people who already know you: newsletter, founder posts, community presence, owned social that actually clicks through.
Finite bursts
Real, but time-boxed: a client migration campaign, a conference season, a launch sequence, a press moment. They belong in the model with a beginning and an end.
You can always add sophistication later. For most pre-seed and seed teams, a few honest rows beat a single polished fiction.
SEO is slow at the beginning
SEO can become one of the most durable parts of the funnel. It is also one of the easiest rows to inflate in month one. On a fresh domain, with no backlog of authority, I start with modest monthly visits and let growth and a cap do the work. If you already have brand demand or strong inbound links, you can loosen that — most teams I work with do not.
A workable first pass: pick a believable starting visit count, add moderate month-on-month growth, set a max visits ceiling, and tie conversion to intent on the landing side. Narrow, high-intent pages can carry higher trial rates than broad educational pieces, even when the traffic count stays small.
Organic is still a real investment
Unpaid traffic is still expensive in the only currency that matters on a small team: hours. Writing, editing, design, distribution, tooling, and the engineering that keeps the site fast — it all shows up somewhere. When organic is modeled as free upside with no counterpart in time or cash, you almost always get both traffic and cost wrong.
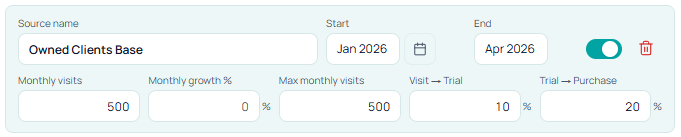
Warm audiences behave differently
Some of the cleanest early SaaS launches I have modeled came from shops that already knew their buyers: agencies, consultancies, or service businesses that productized part of their work. They walked in with inboxes, CRMs, and relationships that could become the first serious traffic. The product story was new; the trust was not.
You do not need an old services business to have a version of that. A founder with a real newsletter, a tight LinkedIn audience, or a community where they are a regular can sit in the same bucket: warm traffic that converts differently from cold search.
I still treat those pushes as finite. A three-month launch to a warm list gets a start and an end, a plausible visit count per month, and conversions that reflect how targeted the message is. You do not need a full depletion model on day one — you need a window that stops when the real campaign stops.
Email benchmarks from providers such as Mailchimp are a gentle sanity check: in the aggregate, open and click-through rates imply that most sends move a modest slice of the list to the site, unless the list is unusually tight and the offer is narrow.
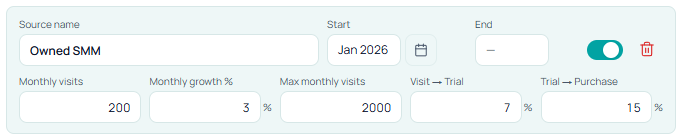
Don't model followers — model visits
Follower counts are easy to read off a profile. They rarely map cleanly to site visits. I skip elaborate impression funnels unless the team already measures them. Instead, estimate monthly visits driven by the rhythm of posting, how well the audience matches the product, and whether posts give someone a reason to leave the feed.
When the founder is the channel, a smaller aligned audience often outperforms a large vague one — the conversion column is where that shows up.
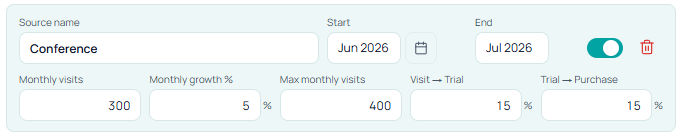
Use end dates for conferences and launch spikes
A good conference or launch week can move the needle. It is rarely a permanent monthly engine. I model those windows short, keep traffic believable for the season, and lift conversion when the room is tightly matched to the product. If the upside is larger than I modeled, that shows up as a pleasant surprise — not as a baseline I have to defend for twelve quarters.
Traffic quality matters as much as traffic volume
Once sources are split, the next lever is honest conversion by source. Two rows can show very different visit counts and still land near the same number of new subscribers — or the smaller row can win outright when the audience arrives with intent.
Published benchmarks for visitor-to-trial and trial-to-paid (for example summaries from firms such as First Page Sage) can sit in the background as orientation. I treat them as upper-range stories for strong self-serve funnels, not as defaults for a brand-new product on a fresh site.
First Page Sage — SEO conversion rate discussion
Same month, two different stories
Broad SEO-style traffic
- 1,000 visits
- 3% visit → trial
- 15% trial → paid
≈ about 5 new subscribers
Tight CRM / newsletter traffic
- 300 visits
- 12% visit → trial
- 25% trial → paid
≈ 9 new subscribers
The smaller source wins here because the traffic quality is higher.
Trial versus freemium changes how those signups turn into revenue on the calendar — Free Trial vs Freemium walks through that split.
How this maps inside Stavia
Each Organic / Owned source carries a start month, an optional end month, visits, growth, a max cap, and its own visit-to-trial and trial-to-paid assumptions. In trial mode, visits flow to trials and new paid subscribers inside the same month. In freemium mode, the same visit logic feeds free signups first; paid conversion follows the freemium mechanics described in Free Trial vs Freemium.
That is enough to stress-test the questions founders actually ask: slower SEO, a shorter CRM push, social that converts well on thin volume, a conference bump that disappears after summer.
Paid, partners, and referral sit alongside this in How to Model Acquisition Channels for Self-Serve SaaS. Once people pay, pricing and churn take over — How to Model SaaS Pricing Before Launch covers that handoff.
How to use Stavia Models for organic and owned acquisition
Give each source its own row, then read the forecast the way you would walk a cofounder through the plan.
- In Inputs, open Acquisition and add Organic / Owned sources for each real shape you need — compounding SEO, steady newsletter or social, a finite CRM or conference window, and so on.
- For each source, set start month, optional end month, monthly visits, growth, and a max visits cap.
- Set visit → trial and trial → purchase (or your funnel equivalent) per source so warm and cold traffic do not share one generic rate by accident.
- Go to Monthly Forecast and expand Acquisition to see visits, trials, and new subscribers by source.
- Read organic / owned next to paid and other channels in the same view so blended CAC and growth mix stay honest.
First-pass traffic numbers will be wrong sometimes. The point is to lay out assumptions clearly enough to revise them when real data shows up — not to lock in a heroic curve you are afraid to touch.
Common founder mistakes when modeling organic and owned acquisition
A simple way to set your first numbers
List three or four sources you can name out loud: one compounding, one steady owned, one finite, maybe a small experiment. For each, set visits, growth, a cap, visit-to-trial, trial-to-paid, and an end month when the activity is temporary.
That is already enough to see tradeoffs. You can layer detail when you have data; you do not need a full attribution stack to get a useful first forecast.
Conclusion
Organic and owned belong in a SaaS forecast because they are part of how companies actually grow. The version that still reads well six months later is specific: a handful of sources, conservative early traffic, conversions that match intent, and end dates where real life has them. Those sources sit inside a connected startup financial model alongside paid, partners, and referral.
In Stavia Models, Organic / Owned stays deliberately simple: separate sources, shared totals, and a straight path from visits into trials or signups and the rest of the forecast. Enough structure to stress-test the story, without turning the model into homework.
About the author

Anastasiia Nikolaeva
Founder of Stavia Models
Anastasiia Nikolaeva is a financial modeling consultant and the founder of Stavia Models. She has built financial models for SaaS, AI, marketplace, and other startup business models, helping founders plan pricing, growth, fundraising, and unit economics. Stavia Models is based on this hands-on consulting experience and turns that modeling logic into a guided product.