Which Startup Costs Should Sit in Cost of Revenue?
Use this article to decide which costs belong close to gross margin, which should stay in overhead, and how that choice changes pricing, unit economics, and the way investors read your model.
See how cost of revenue changes your margins
Model free users, paid users, and serving costs to compare paid-user margin with company gross margin over time.
Why this gets confusing
The idea sounds simple until a real product starts taking shape.
Classic subscription SaaS had a familiar picture: hosting-like delivery and relatively high gross margin. Today you also see API-heavy stacks, AI-heavy features, and generous free or trial usage. Rent, admin support, legal work, and general software subscriptions still read clearly as overhead. The harder cases sit next to the product: a free tier that burns real resources, an AI line item that spikes with adoption, a metered vendor that tracks usage, a salary that feels like delivery but is still payroll.
When those lines land in the wrong place, the margin story drifts. Cost of revenue can look artificially low if serving spend sits in SG&A. It can look artificially high if payroll or other company buildout is folded into gross margin. Either way, pricing calls, packaging, and investor conversations rest on a blurred picture.
What cost of revenue means
Cost of revenue is what it costs to run the product for the users you have today and to collect payment from them. It is a founder question first: which dollars move because someone used the product or paid a bill, as opposed to dollars that move because you hired, bought tools for the company, or ran a campaign.
The split matters because gross margin and unit economics sit on top of it. Mislabel a line and you will misread how much room you have on price, how expensive free usage really is, and how comparable you are to another SaaS or AI business. Those layers sit inside a wider startup cost structure model where COGS, overhead, payroll, and one-time spend each have a place.
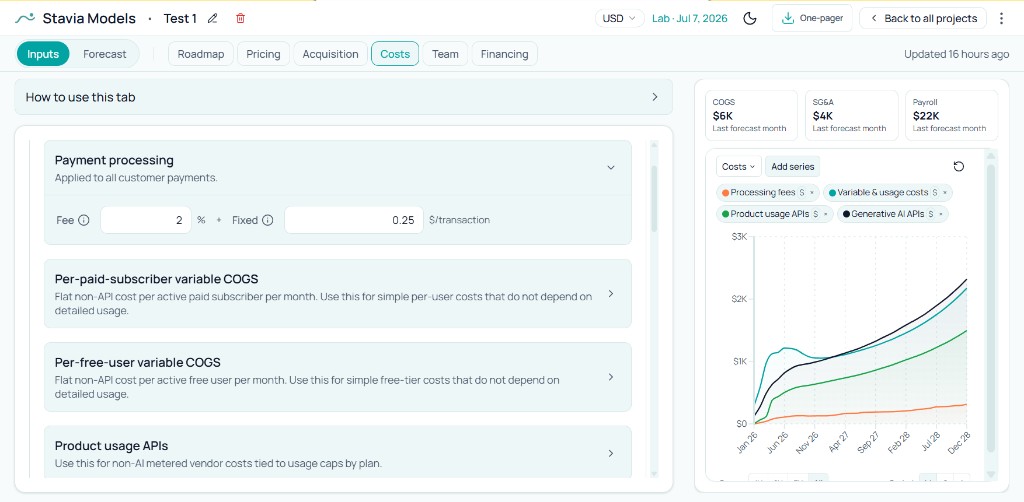
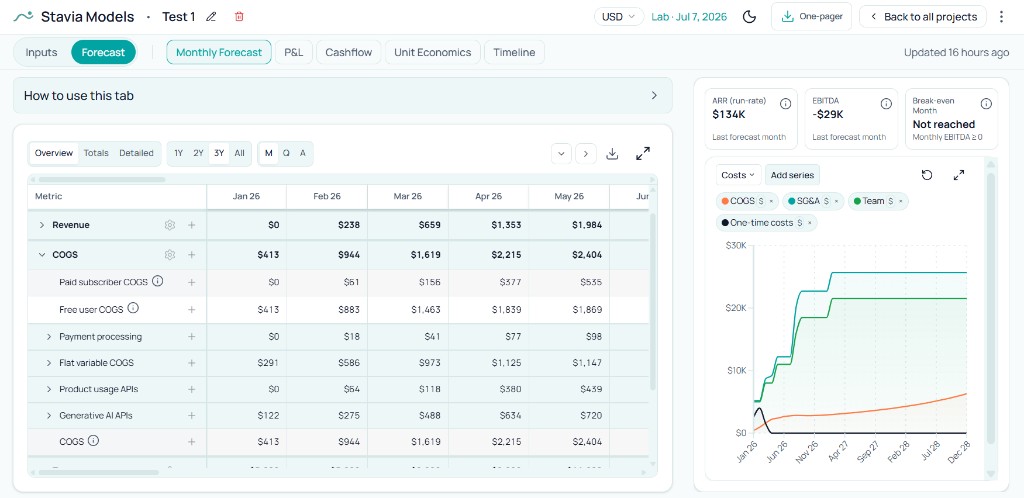
In Stavia, that layer is expressed as payment processing, per-user serving lines for paid and non-paid users where you need them, and usage-based product and AI API cost. The intent is the same in any model: keep delivery and monetization close to margin, and keep the rest of the company below it.
What usually belongs there
In practice, cost of revenue shows up as the bill that grows when usage or paid seats grow. Start from a concrete question: if one more person uses the product this month, what line item on your vendor stack moves? For a simple B2B SaaS product, that might be a flat per-active-user estimate for infra or support tooling. For an API-heavy product, it is often metered third-party spend tied to calls, messages, or data. For an AI-heavy product, it is frequently token or request cost that tracks feature adoption and plan caps — see AI/API cost forecast for caps and utilization, or action-based AI product cost forecasting when prompts, generations, or workflow runs each create variable spend.
Non-paid users belong in the same economic picture when they consume real delivery. Trials and free tiers can pull compute, APIs, and AI budget before paid revenue catches up. If that cost is missing from cost of revenue, company gross margin looks stronger than the business really is, even when paid-user math still looks fine on a spreadsheet.
Payment processing fits last in that story: it rises with money collected, so it sits next to revenue in the model. Once the usage and user-driven pieces are clear, the fee line is easy to place.
Real company examples
Public company filings are useful here because they show how different software businesses actually describe cost of revenue.
Twilio is a good example of an API-heavy business. In its annual reporting, cost of revenue is driven primarily by fees paid to network service providers, plus infrastructure and direct customer-support cost. That is what cost of revenue looks like when the product depends heavily on third-party delivery layers.
HubSpot is a cleaner subscription-software example. Its reporting describes cost of subscription revenue primarily through hosting providers and other third-party services. That is much closer to the classic SaaS picture founders often have in mind when they expect relatively high gross margins.
Datadog shows a third pattern. Its cost of revenue is heavily influenced by third-party cloud infrastructure and software costs, which makes sense for a product where usage intensity and data scale matter directly to delivery economics.
These examples are useful because they show that cost of revenue is not one universal checklist. It changes with the product model, the delivery stack, and how much of the product depends on third-party infrastructure.
What should stay outside
A cost can feel closely connected to the product and still belong outside cost of revenue.
Payroll is the clearest example. Product and engineering salaries are critical to the business, but they are still driven by hiring decisions, roadmap timing, and company structure. That is why payroll sits outside cost of revenue in this model.
Recurring overhead stays outside too. Software subscriptions, accounting, insurance, admin services, and similar costs matter for burn, but they do not usually scale in the direct "this customer used the product today" way that cost of revenue is trying to capture. The same is true for one-time costs such as legal setup, launch work, or project-based implementation. They are real costs, but they do not belong close to gross margin.
Acquisition spend is another common source of confusion. It is customer-related, but it is still growth spend rather than cost of delivery.
The gray areas
The hardest classification cases usually come from costs that sit between product and company.
One common mistake is pushing product and engineering payroll toward cost of revenue because the work feels essential to delivery. In practice, that makes gross margin too heavy and hides hiring decisions that should stay visible elsewhere.
Another is burying usage-based product cost in overhead. If the cost scales with plan limits, utilization, or user behavior, it belongs much closer to gross margin than a general company-running expense.
Free and trial usage is another frequent blind spot. The company may show attractive paid-user economics and still carry a meaningful margin problem because non-paid users are expensive to serve.
And finally, founders often keep flat assumptions too long. A simple per-user line is useful in the beginning, but once a product becomes meaningfully usage-driven, it is better to model it as usage-based cost instead of leaving it as a flat dial forever.
How it changes margins
Where you book a cost changes two numbers founders lean on every week: headline gross margin and paid-user unit economics. They answer different questions, and neither replaces the other.
Company gross margin is revenue minus total cost of revenue. Everything you treat as delivery and monetization—processing, metered APIs, AI spend, and real cost to serve free or trial users—rolls into that top-line margin. If non-paid usage is material and you park it below gross profit, the company looks more profitable at the gross line than the operating reality supports.
On a formal P&L, the same classification becomes gross profit and gross margin percent. Misfile serving cost and that percentage misleads everyone who uses it for pacing, runway, or comparables. Push payroll or generic overhead into cost of revenue and gross margin understates how much room you truly have below the line.
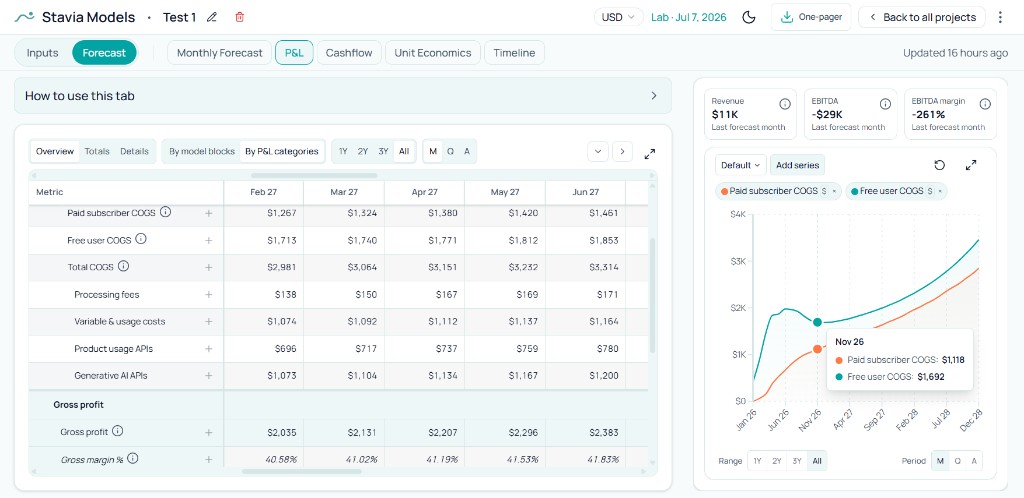
Paid-user unit economics is intentionally narrower. It isolates what it costs to serve someone who is already paying: processing, paid-side variable cost, and paid usage or AI. That tighter unit margin is the right place to stress-test price, plan design, and contribution per account. Free and trial delivery is usually left out of that per-paid view so you do not blend conversion economics with the cost of running paid accounts.
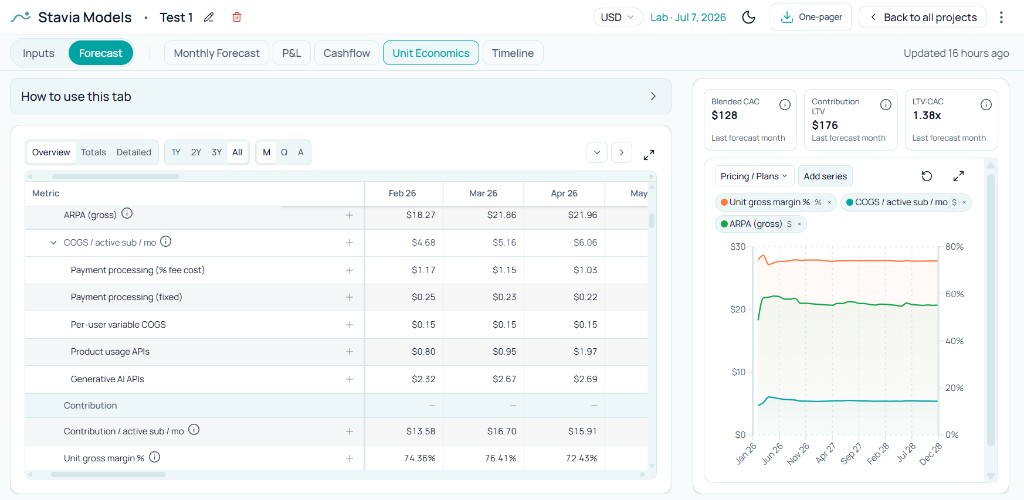
The two can diverge in a way that surprises boards and founders. Paid accounts can look fine on a per-subscriber basis while company gross margin is soft because trials, free tiers, or exploration traffic burn real infrastructure and API budget. That pattern shows up often in PLG, API-heavy products, and AI-heavy features where usage spikes before revenue does.
Benchmark context helps here, but only when founders compare themselves to the right kind of business. Broad SaaS benchmark data often shows healthy gross margins in the high-70s or low-80s. That is useful for classic subscription software. It becomes much less useful for API-heavy or AI-heavy products, where the cost of delivery can sit much closer to revenue. In those businesses, lower gross margins do not automatically mean the model is broken, but they do make packaging, pricing, and free usage policy much more important. For orientation, see Benchmarkit and the BVP Cloud Index. AI-heavy and inference-heavy products often sit far from those medians; BVP's State of AI reporting is a useful second read when your delivery stack looks more like that than like classic subscription software.
In Stavia
Start from what triggered the invoice, not from the chart of accounts.
Serving and collection belong in cost of revenue: processing, flat per-user lines when that matches your stack, and usage-based product or AI lines when behavior drives the bill.
Running the company stays outside: payroll in Team, recurring overhead in SG&A, lumpy work in one-time costs, acquisition in its own lane.
That separation is what keeps forecast, P&L, and unit views aligned with how classic SaaS, API-heavy, and AI-heavy products actually spend money.
Common mistakes
Conclusion
Clean cost-of-revenue classification is how you keep company gross margin and paid-user math both legible.
You see the full burden of serving the product—including expensive free or trial usage—without blurring it with payroll, overhead, or growth spend. You still get a tight read on what each paying customer costs to deliver, which is what pricing and packaging decisions need. COGS boundaries are one layer in a startup financial modeling guide that connects serving cost to pricing, acquisition, and runway.
That split is the difference between a model that matches the business and one that quietly steers you wrong.
About the author

Anastasiia Nikolaeva
Founder of Stavia Models
Anastasiia Nikolaeva is a financial modeling consultant and the founder of Stavia Models. She has built financial models for SaaS, AI, marketplace, and other startup business models, helping founders plan pricing, growth, fundraising, and unit economics. Stavia Models is based on this hands-on consulting experience and turns that modeling logic into a guided product.