When to Use Top-Down vs Bottom-Up Forecasting in a Startup Financial Model
Market sizing can show that an opportunity is worth exploring. A top-down model can turn that opportunity into a first revenue scenario. But when founders need to plan pricing, acquisition, hiring, runway, and fundraising, the forecast has to become bottom-up and event-driven.
Why this matters
Founders hear a lot about TAM, SAM, SOM, and market sizing. That work is useful because it helps frame the opportunity. After the first sizing exercise, the next question is usually broader: how large could this become, and is that worth the years of execution ahead?
TAM, SAM, and SOM describe the opportunity. A top-down scenario can translate a reachable share into customers and revenue over a horizon. Financial modeling still has to go further: conversion, churn, cost-to-serve, hiring, financing, and the month each of those forces shows up on the calendar.
The TAM / SAM / SOM concept is useful for framing the market. It helps a founder explain the size of the opportunity, narrow the first reachable segment, and define what an early target could look like.
It becomes risky only when this market-sizing exercise is treated as the forecast itself. A reachable market is not the same as an operating path. The next step is to translate the opportunity into a simple financial scenario, and then test that scenario through bottom-up assumptions.
Start with market sizing
Imagine a startup building an AI customer-support assistant for small SaaS teams: a subscription product that helps small software companies answer customer questions, draft replies, summarize tickets, and reduce support load. Before building a detailed forecast, the founder may start by sizing the opportunity.
In a real project, the founder would build these numbers from market research: industry reports, company databases, product directories, competitor pricing, customer interviews, and their own definition of the first target segment. The goal is not to find a perfect number. The goal is to create a reasonable first view of the market and make the assumptions visible.
For this example, we use simplified illustrative assumptions. We assume that the product could charge around $250 per month, or $3,000 per year, for a small SaaS team. That annual price becomes the revenue-per-customer assumption used in the market-sizing exercise below.
Start with the size of the opportunity
TAM
All small SaaS and digital-product teams globally
300,000 companies x $3,000/year
$900M
SAM
Initial reachable segment by geography, language, or niche
50,000 companies x $3,000/year
$150M
SOM
Realistic first target over 5 years
1,500 customers x $3,000/year
$4.5M ARR
This is not yet a financial forecast. It is a market-sizing exercise.
The founder is saying: if this type of product can eventually serve 1,500 customers in the reachable segment, and each customer pays about $3,000 per year, the first meaningful target could be around $4.5M ARR.
That is useful. It gives the opportunity a shape. But it still does not explain how those customers appear, how long it takes to acquire them, what churn does to the base, how much acquisition budget is needed, or whether the company can fund the path.
The first financial step: a top-down model
After market sizing, the founder can turn the opportunity into a simple top-down financial model.
The SOM example above says: 1,500 customers x $3,000 per year = $4.5M ARR. The same assumption can also be written monthly: $3,000 per year divided by 12 months equals $250 per month.
So the first top-down model does not yet start with campaigns, conversion, churn, or hiring. It starts with a simple question: what happens if this product reaches 1,500 active customers by Year 5 at an average price of $250 per month?
Top-down revenue scenario
Adjust the target customer base and price to see how a simple top-down revenue scenario changes over five years.
Five-year ARR path with active customer base
This is the next step after market sizing. The founder is no longer looking only at the size of the market; they are translating a reachable share of that market into customers and revenue over time.
The five-year path is still simplified. It says that the company could move from 100 active customers in Year 1 to 1,500 active customers in Year 5. At $250 per month, each customer represents $3,000 in annual revenue, so the Year 5 result becomes $4.5M ARR.
This is useful for framing ambition. But the model still starts from the destination. It shows what the business could become if it reaches the target, without yet explaining how those customers are acquired, when spend happens, how churn affects the base, or whether the company can finance the path.
What top-down still hides
Now the same top-down target becomes more demanding.
The first chart only shows active customers and ARR. But a subscription business does not simply add customers once and keep all of them forever. Some customers leave. That means the company needs gross customer adds not only to grow, but also to replace churn.
For the illustration below, we add two simple assumptions: monthly churn of 3% and blended CAC of $900.
A 3% monthly churn assumption means that, over a year, the company keeps roughly 69% of the previous customer base. So to reach each year-end customer target, the company needs to add enough new customers to replace churn and still grow. Then we multiply those gross customer adds by the blended CAC to estimate the acquisition spend implied by the top-down scenario.
The same target with operating implications
Add churn and CAC to see how the same revenue target implies more gross customer adds and acquisition spend.
ARR, acquisition spend, active customers, and cumulative gross adds
This is still not a full bottom-up model. It is a stronger top-down scenario because it adds operating implications.
Now the founder can see that 1,500 active customers by Year 5 may require more than 2,000 gross customer adds over the period, and close to $2M of cumulative acquisition spend if blended CAC is around $900.
But the model still does not answer the timing question. It does not show when campaigns start, how long conversion takes, which months carry the spend, when hires are needed, or whether the company has enough cash while the customer base is being built.
That is the point where top-down modeling has done its job. The founder now needs a bottom-up, event-driven forecast.
Move to bottom-up event-driven forecasting
Bottom-up forecasting starts from the operating sequence.
The founder no longer writes only "100 customers in Year 1." They define what has to happen for those customers to appear: when the product is ready, when acquisition starts, how traffic turns into trials, how trials turn into paid subscribers, how churn reduces the base, when costs begin, and when financing lands.
This is why bottom-up forecasting is event-driven. The model is built from actions and timing, not only from annual targets.
Bottom-up forecast: events become monthly numbers
Timeline events
- MVP build
- Beta
- Launch
- Hires
- Financing
Input drivers
- Pricing
- Acquisition
- Churn
- Cost-to-serve
- Team
- Overhead
- Financing
Monthly engine
- Visits -> trials
- Paid customers
- Revenue
- Costs
- Cash
Forecast views
- Detailed forecast
- P&L
- Cash Flow
- Unit Economics
After this point, the model is no longer only asking whether the startup can reach a target number of customers. It starts asking how those customers are created, supported, retained, and financed over time.
Pricing defines what the company sells: subscription plans, tiers, billing options, plan mix, and churn assumptions. This is where the model starts to translate a general price assumption into a real revenue structure. A product may have one simple plan, several tiers, monthly and annual billing, or a freemium layer that converts into paid subscribers later.
Acquisition defines how customers enter the model. That can include paid campaigns, organic traffic, referrals, partnerships, affiliates, direct sales, or founder-led outreach. The important part is not only the channel name. The model needs to show when each channel starts, how much it costs, what volume it can generate, and how traffic, leads, trials, demos, or signups become paying customers.
Costs define what it takes to deliver and operate the product. For a software or AI product, this can include product-serving costs, payment processing, hosting, API usage, AI serving costs, tools, overhead, professional services, and one-time launch or transition expenses.
Team and payroll define when people join the company. This matters because hiring usually starts before the revenue impact is fully visible. A founder may need product, support, marketing, sales, or administrative capacity before the model is profitable.
Financing defines when cash enters the business. Founder funding, grants, bridge rounds, or investor rounds do not just exist as annual totals. They land in specific months and change runway from that point onward.
This is the real difference between a top-down scenario and a bottom-up forecast. Top-down shows the target. Bottom-up shows the operating chain that could make the target possible. Once those inputs connect, how to read a startup financial model after you build it shows how P&L, Cash Flow, and Unit Economics fit together as decision lenses.
The easiest way to make this less abstract is to look at how an event-driven, bottom-up model is structured in practice. Stavia Models is built around this logic: founder inputs are organized by business decision, then connected into one monthly forecast engine. The screenshots below use Stavia as the example, but the modeling principle is broader than the product itself.
How this looks in Stavia Models
In Stavia, the bottom-up model starts on the input side. The founder does not enter one revenue target and ask the model to fill the rest. Instead, they build the forecast from connected operating assumptions.
Pricing defines plans, billing mix, plan mix, and churn. Acquisition defines channels, budgets, conversion, and timing. Costs define product-serving spend, overhead, and one-time expenses. Team defines when roles start and how payroll builds. Financing defines when cash enters the company.
Each input area describes one part of the business, but the logic is connected. A pricing decision affects ARPA, LTV, revenue, and cash timing. A churn assumption affects subscriber movement and unit economics. An acquisition budget affects traffic, trials, paid customers, CAC, revenue, and runway. A hire affects payroll, burn, and cash flow from the month they start.
How event-driven logic flows through the model
The flow is simple, but important.
Input tabs define the assumptions. Events and drivers give those assumptions timing. The monthly forecast engine connects the logic. Forecast views show the results from different angles.
That is why the same business decision appears in several places. A churn assumption is not only a pricing input; it affects subscriber movement, revenue, unit economics, and cash. A paid acquisition campaign is not only a marketing line; it affects acquisition spend, trials, new subscribers, CAC, revenue, and runway. A financing round is not only a funding amount; it changes the cash path in the month when it arrives.
The detailed forecast shows mechanics month by month. P&L shows operating structure. Cash Flow shows survival and timing. Unit Economics shows customer-level growth quality. Together they turn the model into a decision environment, not only a spreadsheet output.
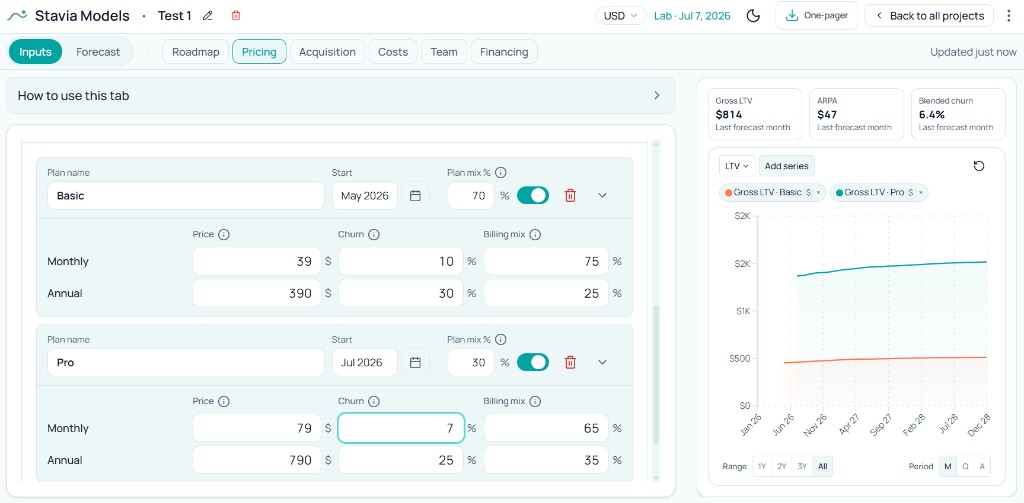
The Pricing tab shows the first layer of the bottom-up model: what the product sells and how customers behave after they subscribe.
In this example, different plans can have different prices, billing mix, plan mix, and churn. That matters because pricing is not just a revenue assumption. It affects ARPA, LTV, subscriber movement, cash timing, and unit economics.
This is already different from a top-down model. Instead of saying that the average customer pays a fixed amount, the founder can see how each plan contributes to the blended forecast.

The Acquisition tab turns the customer target into funnel mechanics.
A top-down scenario may say the company needs hundreds or thousands of customers. The acquisition layer asks how those customers are supposed to appear. Which channels start first? What budget does each channel receive? How much traffic or lead volume does that create? What share converts into trials, demos, signups, or paid customers?
This can include paid acquisition, organic traffic, referrals, partners, affiliates, direct sales, or other channels. The important point is that acquisition is no longer a single growth assumption. It becomes a set of timed operating drivers.
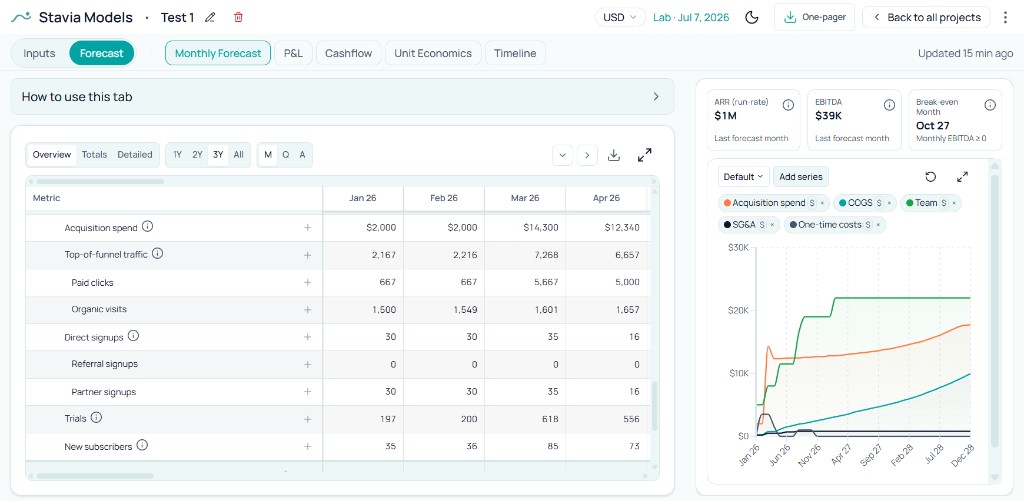
The detailed forecast shows the operating chain month by month.
This is where the founder can trace how input assumptions become forecast outputs: acquisition spend, traffic, clicks, trials, signups, new subscribers, revenue, COGS, payroll, overhead, financing, and cash movement.
If the top-down scenario says the company should reach a certain customer base, the detailed forecast shows whether the modeled actions can actually create that path. It makes the logic auditable: the founder can see which assumptions create which results.
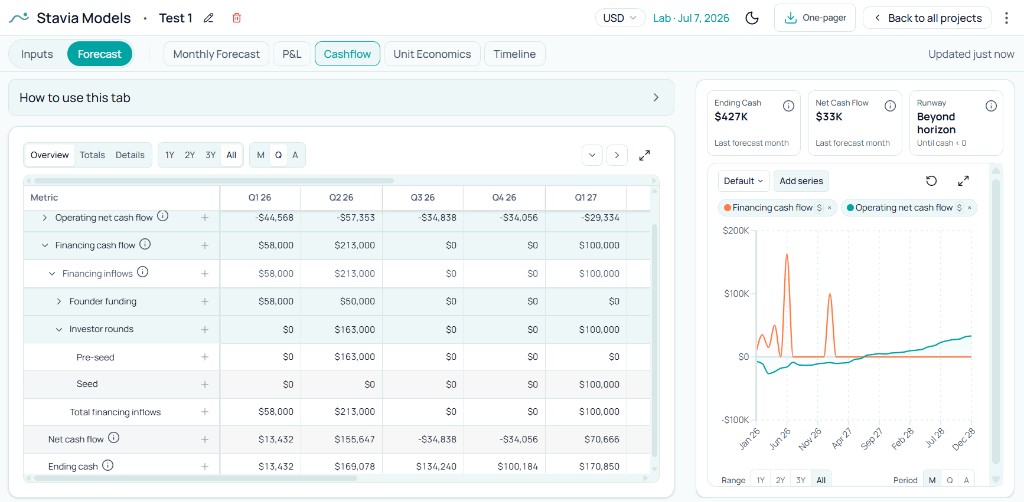
The Cash Flow view shows whether the operating path is survivable.
A top-down forecast can look attractive in Year 3 while the company still runs out of cash in Month 10. Cash Flow shows when operating burn happens, when financing arrives, how ending cash changes, and whether the company has enough runway to reach the next milestone.
This is why timing is not a detail. In a startup financial model, the order of events can be as important as the final annual numbers.
Stavia does not replace market research. It helps with the next step: turning a market thesis into a structured operating model that can be read through connected forecast views, including Timeline for milestone sequencing alongside cash.
For a fuller read across views, see How to Read a Startup Financial Model After You Build It.
Why timing changes the answer
Timing is the reason bottom-up forecasting matters so much for startups.
A yearly top-down scenario can show a smooth path to revenue. A monthly bottom-up forecast shows the sequence behind that path.
Revenue may not start in January. Campaigns may begin later than the model year. Trials need time to convert. Payroll can start before revenue catches up. Customer-facing AI cost-to-serve can rise as usage grows. Financing lands in a specific month, not vaguely "in Year 1."
Any of these timing details can change the plan.
This is why a company can look attractive in Year 3 and still run out of cash in Month 10. The annual target may be reasonable, but the monthly path may still be too fragile.
When to use each approach by startup stage
When each approach is useful
Idea
Exercise
Market sizing
Question
Is the opportunity worth exploring?
Prototype
Exercise
Top-down scenario + first operating assumptions
Question
What could this become if the early thesis works?
MVP / launch
Exercise
Bottom-up event-driven forecast
Question
What needs to happen month by month?
Fundraising
Exercise
Both views
Question
Is the market story supported by an operating plan?
Post-launch
Exercise
Bottom-up forecast updated with real data
Question
Which assumptions were wrong, and what changes now?
At the idea stage, a founder does not need a detailed monthly model for every cost line. The first task is to understand whether the opportunity is meaningful enough to explore.
At the prototype stage, the founder can start translating that opportunity into a simple top-down scenario and early operating assumptions. This is where price, target customers, and first acquisition ideas begin to appear.
At MVP and launch planning, the question changes. The founder needs to know what starts when, what cash is required, which channels are tested first, and what has to happen before the next milestone.
At fundraising, both views matter. Investors need to understand the market story, but they also need to see that the founder understands the operating path behind it.
After launch, the model should become more evidence-based. Real conversion, CAC, churn, usage cost, and cash movement should replace early assumptions.
Top-down scenarios can also be useful later as a strategic check. If the bottom-up model produces a very small outcome, the founder may need to revisit the target segment, pricing, distribution strategy, or ambition. Bottom-up detail is not enough if the overall opportunity is too small.
Common mistakes
Final thought
Top-down forecasting helps founders define the destination. Bottom-up forecasting helps them test the road. A startup needs both views at different moments. Market sizing and top-down modeling help explain why the opportunity matters. Bottom-up event-driven modeling helps show whether the company can actually reach that opportunity through pricing, acquisition, product delivery, hiring, and financing.
The strongest startup financial model connects both: market ambition on one side, operating logic on the other. That is where the forecast becomes more than a revenue projection. It becomes a way to understand whether the business can actually be built. The full framework lives in a connected startup financial model that walks through pricing, acquisition, costs, runway, and fundraising as one system.
About the author

Anastasiia Nikolaeva
Founder of Stavia Models
Anastasiia Nikolaeva is a financial modeling consultant and the founder of Stavia Models. She has built financial models for SaaS, AI, marketplace, and other startup business models, helping founders plan pricing, growth, fundraising, and unit economics. Stavia Models is based on this hands-on consulting experience and turns that modeling logic into a guided product.