How to Read Startup Unit Economics Without Fooling Yourself
Unit economics shows whether growth is worth scaling. This article explains how to forecast CAC, payback, LTV, churn, and contribution before the data is mature — and how to turn those assumptions into targets for pricing, acquisition, retention, and product strategy.
Why unit economics matters before you have perfect data
Unit economics is often treated as something to measure only after cohorts mature. For early-stage teams, the forecasting version matters just as much because it makes strategy testable before expensive decisions are locked in. It shows whether the plan can carry itself if CAC rises, churn runs hot, or serving cost grows faster than expected.
In practical terms, this is where founders pressure-test questions that shape survival: with this pricing, what CAC can we afford; with this cost-to-serve, does this plan still hold; how much churn can the model tolerate; how short does payback need to be for current runway; which channels support the economics; and which plan mix improves quality versus only headline revenue.
The forecast turns those questions into operating targets. If the model works only under unusually low churn, the issue is retention and product value. If payback is longer than runway can absorb, the constraint is cash timing as much as acquisition efficiency.
What unit economics is really trying to answer
The core question is simple: is one customer economically attractive enough to support growth at company scale? That answer comes from several linked layers read together, not from one ratio in isolation. Revenue per paid user (ARPA), direct serving cost, contribution, CAC, payback, and lifetime value all move together.
This is why unit economics belongs in the same operating system as pricing, acquisition channels, and cost-to-serve logic. When cost-to-serve includes generative AI, see forecast AI/API costs before launch. When one input shifts, the rest of the chain shifts with it.
How to model unit economics before the data is mature
Early on, most teams do not yet have stable cohorts, enough churn history, or channel performance that has settled. That does not make unit economics unusable. It changes the role: forecast unit economics is a target system built from pricing, plan mix, billing, expected churn, cost-to-serve assumptions, and acquisition inputs.
Example: if CAC is $300 and monthly contribution is $20, simple payback is about 15 months. That already creates a cash-flow question, but it also creates a churn question. The customer needs to stay for roughly 15 months just to recover acquisition cost, which implies monthly churn around 6.7% or lower in a simple lifetime calculation. To recover CAC at all, contribution LTV needs to reach at least $300 on those assumptions. If the founder wants a stronger cushion—for example 2:1 LTV:CAC—the model needs about 30 months of contribution, or monthly churn closer to 3.3%. For 3:1, it needs about 45 months, or churn closer to 2.2%. Those ratios are illustrative, not universal targets; they show why CAC, contribution, LTV, churn, and payback should be read together. If the churn assumption required to make the economics work is not believable for this product or audience, the model is telling the founder where the strategy needs to change. Runway adds another constraint: if the company only has about ten comfortable months of cash, fifteen-month payback still signals stress unless billing, retention, or financing closes the gap.
From forecast assumptions to unit economics targets
From forecast assumptions to unit economics targets
Pricing
Price point, plan mix, billing cadence
Cost to serve
Payment fees, infra, usage APIs, AI cost
Acquisition
Channel spend, conversion, paid customers
Unit economics
ARPA, contribution, CAC, payback, LTV:CAC
Targets after launch
Actual CAC, churn, ARPA, usage cost, payback
A forecast does not prove unit economics. It defines what needs to be tested. As real data arrives, compare actual CAC, churn, ARPA, contribution, and payback with the target model and update the strategy.
The main unit economics layers
A useful reading should not stop at LTV:CAC. That ratio is an output of interconnected assumptions: ARPA, paid-serving COGS, contribution, unit gross margin, churn, expected lifetime, LTV, CAC, and payback. Read them as a chain. Lower ARPA reduces contribution. Higher serving cost compresses margin. Higher churn shortens lifetime. Higher CAC stretches payback.
This chain is what makes unit economics strategic. It tells you which lever needs work first: pricing and packaging, retention, channel efficiency, product limits, or direct serving cost.
Churn is the quiet driver behind LTV
LTV can look precise while still being fragile. In subscription products, churn drives expected lifetime, and expected lifetime drives LTV. If churn is wrong, LTV is wrong. Optimistic retention assumptions can make CAC look efficient in the model when real payback would be much slower.
Churn also varies in ways that matter: by plan, billing cadence, channel, segment, and product maturity. A lower-tier plan can convert well and still churn faster. Annual billing can improve timing and sometimes behavior. A channel can be cheap on CAC and weak on retention quality.
LTV is not only a revenue metric. In a subscription model, it is also a retention metric. Treat churn as a product-quality and customer-fit assumption, not as a technical cell in the model.
CAC and payback: the part founders should not skip
LTV:CAC is useful, but incomplete. Payback is the timing discipline underneath the ratio. A customer can be attractive in lifetime terms while still creating cash pressure if CAC is paid upfront and contribution arrives slowly over months. Churn shapes how many contribution months you actually get; runway shapes how long the company can afford to wait for them.
This is why Unit Economics should be read with Cash Flow. If payback stretches beyond what runway can absorb, growth may look rational in theory and still be hard to finance in practice. For many teams, the better question is not whether CAC is good in general, but whether this CAC is good enough for this contribution, this churn, this runway, and this stage.
Why plan mix changes the story
Blended unit economics helps with direction, but it can hide where strength and weakness actually sit. One plan may carry most of the contribution while another mainly grows volume. A premium plan can lift ARPA while increasing usage cost. A lower-tier plan can improve conversion while weakening retention or margin.
This is where packaging decisions become financial decisions. Upgrade paths, limits, and billing design can be the difference between visible top-line growth and durable economics underneath.
Why channel economics can look different
Blended CAC is a summary, not a strategy. Channels bring different customer quality, payback shape, and scale limits. A channel with higher CAC can still be useful if retention and contribution are stronger. A channel with cheaper CAC may create weaker lifetime value.
Channel-level reading helps decide what to scale now, what to test longer, and where to expect diminishing returns. The objective is a channel mix that supports economics at the stage you are in.
AI and usage-based products need extra care
Usage-based and AI products can look strong on revenue while contribution quietly weakens. Customer-facing AI serving costs, API calls, and usage-heavy features can scale with activity faster than price if limits are loose or packaging is misaligned. In these models, pricing and usage caps are part of unit economics, not a separate product discussion.
Keep the cost boundary clear. Customer-facing AI usage belongs in unit cost-to-serve logic. Internal AI tools used by the team belong in operating expenses and should be read in P&L.
Benchmarks can help, but they do not replace your model
Benchmarks are useful as sanity checks and directional context. They are not fixed targets. CAC, churn, payback, LTV, and contribution depend on ACV, category, sales motion, maturity, retention behavior, and cost-to-serve. Pull from recent reports and more than one source, then fold what you learn into your own pricing, churn, CAC, contribution, plan mix, and cost-to-serve assumptions.
Useful benchmark sources to check
Use benchmark reports as context, not as answers. Check recent reports for your product type, audience, region, and sales motion, then translate that context into your own model assumptions.
The practical use of benchmarks is to make assumptions less random. If your model requires very low churn, very high conversion, or very fast payback, external benchmarks help you ask whether that assumption is realistic for your product type. The benchmark is only the starting point. The answer still depends on your pricing, audience, channel mix, onboarding, retention, and cost-to-serve.
A few benchmark signals worth using carefully
B2C subscription apps. RevenueCat's 2025 State of Subscription Apps shows how wide conversion differences can be: median apps near a 6.2% trial-start rate, while p90 apps reach about 20.3%. Use that spread as context when modeling onboarding, paywall, trial design, and conversion—not as a direct target for every product.
Subscription churn. Recurly's churn benchmark materials often frame monthly churn for subscription businesses around 1–5%, with ~4% cited as a loose reference point. Treat it only as a sanity check; churn varies sharply by category, audience, price point, and billing model.
B2B retention and acquisition efficiency. High Alpha's SaaS benchmarks emphasize how strong net revenue retention pairs with efficient acquisition: teams that combine healthy retention with lower CAC pressure tend to show materially stronger growth and Rule of 40 outcomes. It is a reminder to read CAC alongside retention quality, not in isolation.
| Product / GTM type | Useful benchmark signals | What founders should take from it |
|---|---|---|
| B2B enterprise SaaS | Higher ACV, longer sales cycle, heavier sales effort. Retention and expansion matter heavily. Longer payback can still be logical when contract value and retention are strong. | Do not compare enterprise payback directly with self-serve SaaS or B2C subscriptions. Read CAC, churn, and payback in ACV and sales-motion context. |
| B2B SMB / self-serve SaaS | Lower ACV, faster conversion, greater churn sensitivity, stronger need for acquisition efficiency. Broad subscription churn is often discussed around 1–5% monthly; Recurly cites ~4% as a general benchmark—sanity check only. | Smaller customers usually require tighter CAC discipline and faster payback because lifetime can shrink quickly when churn rises. |
| B2C subscription apps | Trial and conversion vary enormously: RevenueCat's 2025 report cites ~6.2% median trial-start rate versus ~20.3% at the p90—illustrative spread, not a goal for every app. | Model trial-to-paid, churn, ARPU, and acquisition efficiency carefully. Use benchmarks as directional context for onboarding and paywall design, then validate against your own funnel. |
| AI / usage-based products | Usage costs can change contribution materially. AI serving cost scales with activity, so pricing and usage caps matter. | Revenue growth can hide weak contribution when customer-facing AI cost scales too fast. Product limits and pricing are unit-economics decisions. |
| PLG / freemium products | Free users can support growth but still create real cost burden. Activation and free-to-paid conversion matter. | Free users are not automatically free to serve. Model free-to-paid conversion, serving cost, and paid-user economics separately. |
High Alpha, Benchmarkit, Recurly, RevenueCat, and ChartMogul can keep ranges grounded. Your forecast still has to carry its own plan mix, channels, and product constraints, including free paths such as free trial or freemium.
How to compare the forecast with real results later
Once real data arrives, unit economics becomes a feedback loop. Compare actual CAC by channel, free-to-paid conversion, ARPA, churn, serving cost, and payback against the forecast. The gaps tell you what to adjust first.
This comparison is often more valuable than the first model version. It reveals whether differences come from pricing, retention, customer quality, or usage behavior and keeps strategy anchored in evidence instead of narrative.
Why unit economics is not P&L or Cash Flow
Unit Economics is a customer-level lens. It does not replace company-level structure or liquidity timing. A startup can show good paid-customer economics and still run a weak company P&L if fixed payroll, overhead, experimentation spend, or free-user burden is heavy.
It can also show attractive LTV:CAC and still face cash pressure because CAC is often paid upfront while contribution arrives gradually. This is why founders should read Unit Economics with P&L, Cash Flow, and the step-by-step forecast.
How it works in Stavia Models
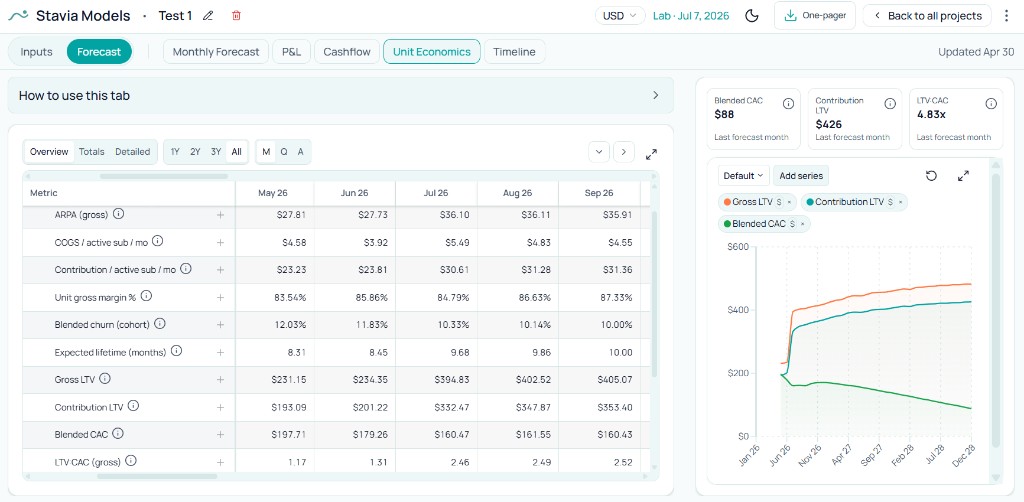
In Stavia Models, Unit Economics is a forecasting and planning view that pulls from pricing, acquisition, churn, and cost-to-serve assumptions. It surfaces blended metrics such as ARPA, paid-serving COGS, contribution, unit gross margin, churn, expected lifetime, LTV, CAC, LTV:CAC, and payback.
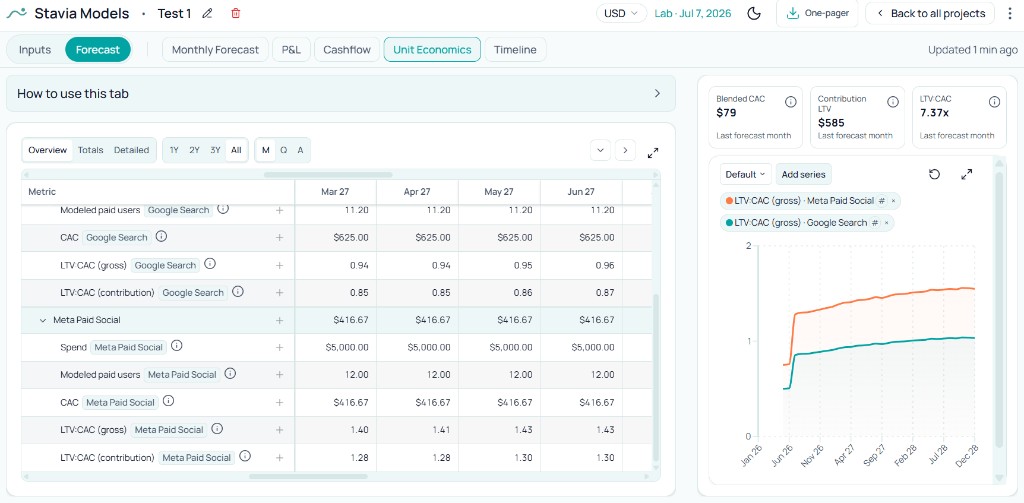
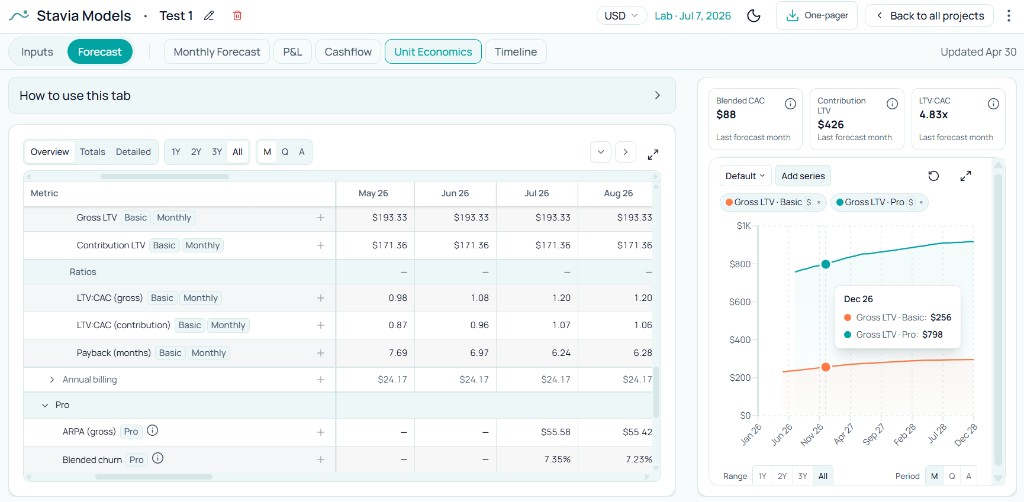
It also supports plan-level and channel-level reading, which matters because blended metrics can hide the real story. One plan can carry economics while another weakens them. One channel can show cheaper CAC but poorer customer quality and slower payback.
The chart panel helps compare Gross LTV, Contribution LTV, Blended CAC, payback, plan-level LTV, channel LTV:CAC, and other selected series across periods. The goal is operational: turn assumptions into measurable targets founders can test after launch.
Common mistakes when reading unit economics
Final thought
Unit economics is where growth quality becomes explicit. It helps founders define what needs to be true for the model to work: pricing that supports contribution, acquisition that pays back in time, retention that sustains lifetime, and serving costs that stay inside plan boundaries.
At the forecasting stage, these are targets, not proof. Their value is practical: they let you decide what to test in pricing, acquisition, retention, product limits, and cash discipline before scale makes mistakes expensive. Unit economics is one lens in a startup financial modeling guide that connects customer-level quality to company-level runway.
About the author

Anastasiia Nikolaeva
Founder of Stavia Models
Anastasiia Nikolaeva is a financial modeling consultant and the founder of Stavia Models. She has built financial models for SaaS, AI, marketplace, and other startup business models, helping founders plan pricing, growth, fundraising, and unit economics. Stavia Models is based on this hands-on consulting experience and turns that modeling logic into a guided product.