How to Read a Startup P&L Without Missing What Matters
A startup P&L helps you see how revenue turns into gross profit, how operating expenses build up, and whether the operating business is moving toward sustainability. This article focuses on the P&L down to EBITDA — the layer early-stage founders usually need most when reading the structure of the business.
What a startup P&L is really for
It is natural to look first at revenue, gross margin, or EBITDA. The deeper value of P&L is in the structure between those lines. P&L means profit and loss statement, also called an income statement, and it is the clearest operating map for how the business turns demand into an economic result.
It shows how revenue becomes gross profit, how operating expenses accumulate, and whether the operating model is moving toward sustainability. For an early-stage company, that is useful well before profitability because it reveals whether the company is getting healthier or heavier over time.
This article intentionally focuses on the operating P&L down to EBITDA. EBITDA means earnings before interest, taxes, depreciation, and amortization. A full accounting P&L can continue below this line, and those items matter, especially later. For founder planning in early stages, the operating layer is usually the first place where decisions become clear.
Read the P&L in layers
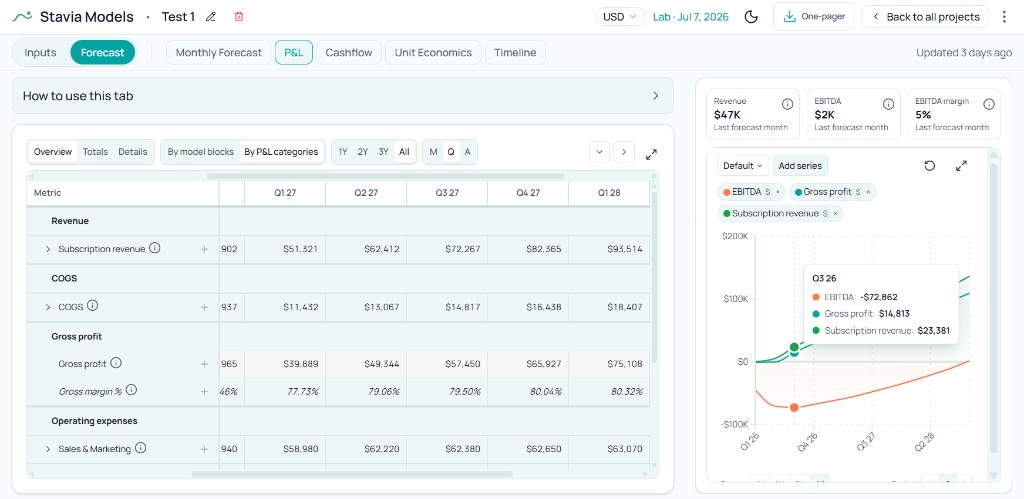
The cleanest read is top to bottom, because each layer answers a different founder question. Revenue shows what the business is generating. COGS (cost of goods sold, often closer to cost of revenue in software) shows what it takes to serve that revenue. Gross profit shows what remains before company structure. Operating expenses show what it costs to sell, build, and run the business. EBITDA shows whether the operating model is progressing toward sustainability.
The order matters because weak EBITDA can come from very different sources: thin gross margin, accelerated hiring, aggressive acquisition spend, or timing mismatches in overhead and one-time costs.
The operating P&L in layers
Revenue is only the starting point
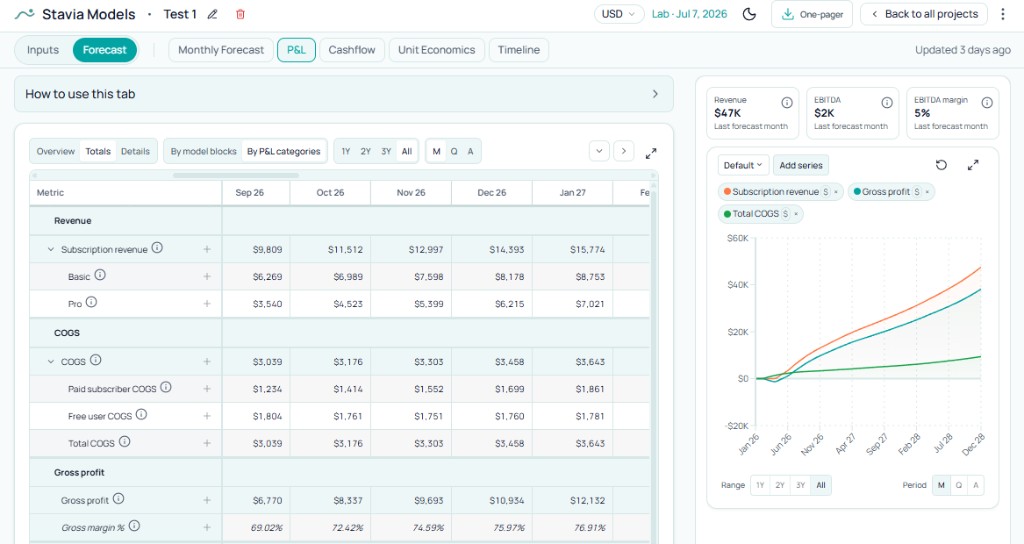
Revenue is the first line everyone notices, but by itself it explains little. In subscription models, recognized revenue can combine plan mix, monthly and annual billing, new subscribers, renewals, and churn movements. It is economically meaningful and still different from cash collection timing.
Growth quality becomes clear only when revenue is read with gross profit and operating spend. A company can scale paid acquisition and grow top-line while serving costs and payroll rise too quickly. Annual billing can improve cash timing while the P&L still needs to be read through recognized revenue logic.
What COGS and gross profit tell you
COGS stands for cost of goods sold. In SaaS, AI, and software businesses, it is often easier to read as cost of revenue: the direct cost of delivering the product or service to customers. When money moves because users activate a feature, process a payment, consume infrastructure, or trigger an API call, that spend usually belongs closer to COGS than to general overhead. Payment processing, hosting, usage-based APIs, and delivery-linked support are typical members of this layer.
Operating expenses sit on the other side of that boundary. They are the costs of building, selling, and running the company after the product has been delivered: acquisition spend, payroll, internal tools, professional services, administration, and one-time operational items. They matter as much as COGS; they simply answer a different question about where money goes.
Customer-facing AI serving belongs with COGS when the product bears model or API charges because end users consume the feature. That includes embedded AI workflows, chat or generation surfaced inside the product, and metered calls tied to customer or free-tier usage. Costs rise when usage rises; that behavior usually tracks with delivery, which is why these lines often land in cost of revenue rather than in overhead. When every prompt or workflow run creates variable spend, action-based AI product cost forecasting helps connect that behavior to gross margin before heavy users or free tiers erode the P&L.
Internal AI tools used by the team usually land in operating expense categories instead: developer tooling such as Cursor, writing or research assistants for marketing and managers, design and analytics subscriptions, finance or admin software. Those purchases shape how the company operates; depending on who uses them and why, they typically roll into SG&A, R&D, or another OpEx bucket rather than COGS.
Gross profit is revenue minus COGS. Gross margin shows how much revenue survives product delivery before acquisition, payroll, overhead, and one-time spend. When margin compresses, founders should inspect pricing, plan caps, usage limits, free-tier economics, and cost-to-serve mechanics. An AI feature can deepen engagement while narrowing margin if serving costs are heavy; payment processing can look small per transaction and still become material at scale.
How to read operating expenses
Operating expenses are the costs of building, selling, and running the business after the product has been delivered. They rarely scale with each customer the way COGS often does, yet they determine whether the company can sustain growth, hire responsibly, and finance go-to-market without overheating. Founders need both the totals and the timing: what is recurring versus episodic, what belongs to this stage versus the next, and which buckets move when assumptions change.
In this article, “one-time costs” means one-time operating expenses: legal setup, launch support, branding, fundraising support, short-term consultants, market-entry work, and other operational spending that hits over a short window. That is separate from capital expenditure. When a company buys or builds a long-lived asset, the cash outlay may be CapEx; in a full accounting model, CapEx hits the balance sheet first and then reaches the P&L through depreciation or amortization, usually below the operating EBITDA layer this guide focuses on. The goal here is a clean boundary: we are discussing operating spend patterns founders control in the near term, not every cash movement on the balance sheet.
Two ways to read operating costs
The same dollars can be read in two complementary ways, and it helps to keep them separate before blending insights.
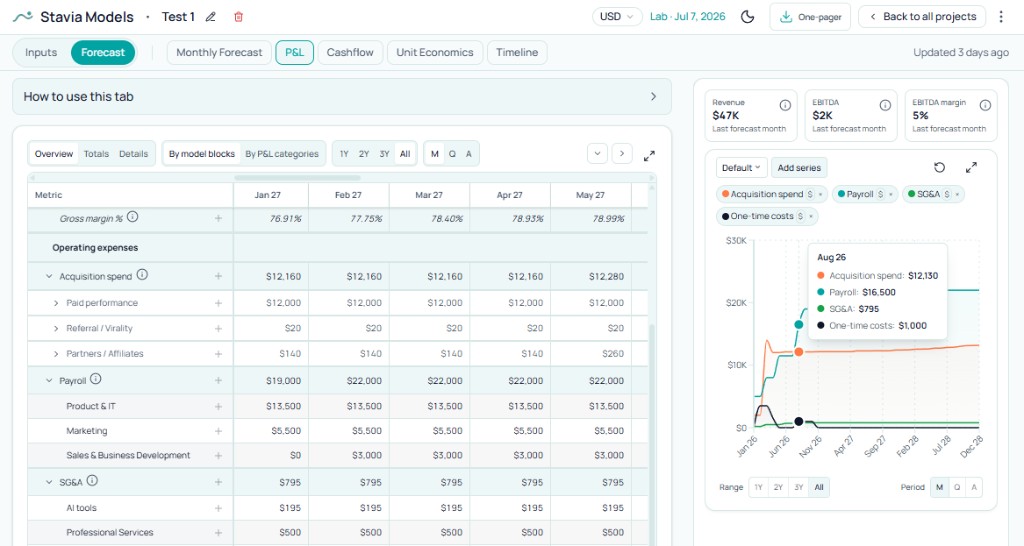
By model blocks is the planning view. It answers which assumption bucket created the cost: an acquisition campaign, a payroll department roll-up, an SG&A line, or a one-time operating item. This is the path back to levers in the forecast.
By P&L categories is the functional finance view. It answers what kind of company spend this is: Sales & Marketing, Research & Development, General & Administrative. This is the path toward understanding organizational shape and benchmarking structure.
A developer salary may sit in a payroll model block while functionally reporting to R&D. A marketing campaign may show up under acquisition spend in the planning view while functionally living in Sales & Marketing. Accounting software or legal support may flow through SG&A in the model block view while mapping to G&A on the income statement. Seeing both lenses keeps planning mechanics aligned with how outsiders read the business.
Timing still matters as much as classification. Sales & Marketing can be powerful later and premature before channels prove out. Payroll can be strategically right and too early if monetization is still forming. G&A often stays lean early and formalizes with scale. Keeping one-time operating costs visible preserves clarity when recurring structure is the real goal.
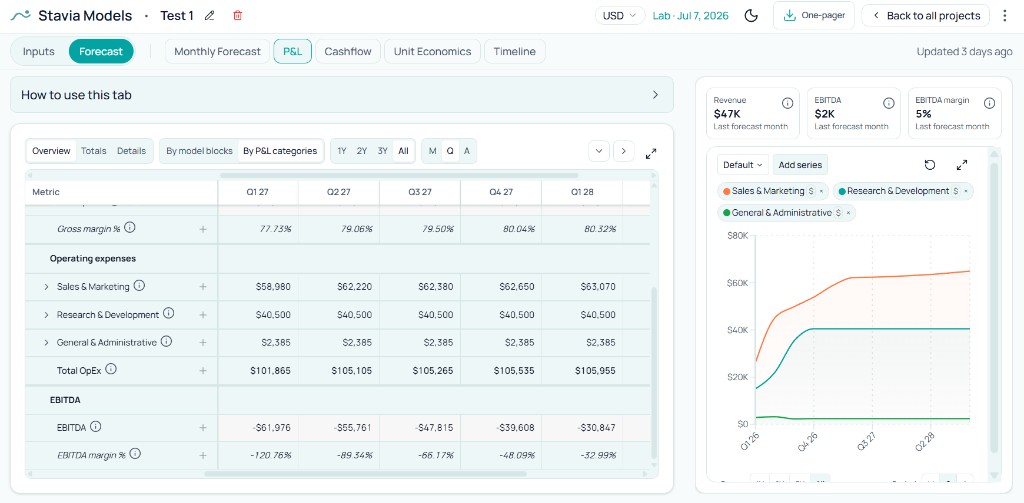
What EBITDA helps you understand
EBITDA means earnings before interest, taxes, depreciation, and amortization. It is used here as an operating-result signal that bundles revenue scale, gross margin, and operating expense structure into one trend line. Cash and net income live on other lines: a full accounting P&L continues below EBITDA with depreciation and amortization, interest, taxes, and other items that complete the picture for shareholders and lenders.
Early-stage EBITDA can stay negative for a long time. The useful question is rarely a single positive quarter; it is whether the vector makes sense. In early months, EBITDA may be negative while the team builds product, tests acquisition, hires ahead of revenue, or carries fixed costs before revenue catches up. Later, founders should expect movement toward operating leverage if gross profit scales faster than OpEx. If revenue grows while EBITDA stalls, the pressure usually sits in gross margin, acquisition intensity, payroll timing, overhead, or one-time items. EBITDA works best as a trend signal about operating shape, while Cash Flow remains the lens for liquidity and runway.
Public-company examples: how to benchmark P&L structure
Public-company filings are useful because they show how real software businesses separate revenue, cost of revenue, gross profit, and operating expenses. Early-stage founders should not copy these numbers directly, but they can use them to understand what a mature P&L structure looks like in practice.
| Metric | Figma | Atlassian |
|---|---|---|
| Product | Collaborative interface design and prototyping | Collaboration and work management software |
| Period | 2025 (Form 10-K) | FY2025 (Form 10-K) |
| Revenue | $1.06B | $5.22B |
| Cost of revenue | $186M | $895M |
| Gross margin | 82% | 83% |
| R&D (% of revenue) | 98% | 51% |
| Sales & Marketing (% of revenue) | 55% | 22% |
| G&A (% of revenue) | 53% | 12% |
| Operating result | Operating loss ~$1.29B (~122% of revenue) | Operating loss around 2–3% of revenue |
| Founder lesson | Strong gross margin can sit alongside a deep operating loss when R&D, sales, and G&A each scale to a high share of revenue; the P&L shows investment intensity, not weak delivery economics alone. | A mature software business can show strong gross margin and still invest heavily in product and go-to-market at company scale. |
Sources: Figma SEC filings · Atlassian annual reports
Even mature software companies with strong gross margins can carry large operating expenses, especially in R&D and go-to-market. That is why founders should read a P&L as a structure, not just as a margin headline. The useful question is not whether a company has high gross margin alone, but how the rest of the operating model sits on top of it.
P&L versus other forecast views
Why P&L and Cash Flow tell different stories
The P&L describes recognized economic performance and operating structure. The Cash Flow statement describes when cash actually moves. Annual or multi-year billing can pull cash forward relative to revenue recognition. Equity or debt financing improves cash balances without improving EBITDA. Large one-time cash outflows can squeeze liquidity even when the P&L looks smooth because expenses are spread across periods. A team can be marching toward operating break-even on paper and still need financing because customer receipts, vendor terms, and payroll cycles misalign. Read both views whenever runway or covenant pressure is on the table.
Why P&L and Unit Economics are not the same
P&L gross margin is a company-level outcome: total revenue minus total COGS. Unit economics zooms in on per-customer or per-subscriber contribution after variable costs. Paid cohorts can look attractive while the consolidated P&L stays weak because free users load infrastructure, fixed OpEx still runs hot, acquisition spend races ahead of payback, and overhead has not yet scaled with revenue. A strong customer engine is necessary; the rest of the organization still has to reach viability around it.
How to use P&L as a founder
Start with revenue trend, then gross margin, then operating expenses read for behavior and timing. Use model blocks to trace which assumptions produced each cost layer; use P&L categories to understand functional company structure. Treat EBITDA as a directional operating signal rather than proof of cash safety. When something looks off, move to the detailed step-by-step forecast for mechanics, Cash Flow for liquidity, or Unit Economics for per-customer quality, depending on which question is open.
How it works in Stavia Models
Stavia's P&L focuses on the operating layer down to EBITDA so founders can read business structure before diving into full accounting detail. Model blocks surface acquisition spend, payroll, SG&A, and one-time operating costs; category view maps the same spend into Sales & Marketing, R&D, and G&A. The chart panel compares revenue, gross profit, EBITDA, OpEx blocks, or functional categories across months or years so shifts stand out visually.
When a line moves unexpectedly, switch to the step-by-step forecast to find drivers, review Cash Flow for runway, and open Unit Economics for customer-level checks. Related reads on cost-of-revenue logic, cost structure, overhead, and payroll timing support the same workflow.
Common mistakes
Conclusion
A startup P&L should help founders see the operating shape of the business. Revenue matters, yet the durable story is how much revenue survives delivery, how much the company spends to grow and operate, and whether those layers trend toward a structure that can hold at scale.
P&L gives structure; Cash Flow gives survival timing; Unit Economics gives customer-level quality; the detailed forecast gives root causes behind the lines. When founders read those views together, the model stops feeling like a static report and starts reading like a narrative of what the business is becoming. P&L is one lens in a connected startup financial model where pricing, costs, and runway share one forecast.
About the author

Anastasiia Nikolaeva
Founder of Stavia Models
Anastasiia Nikolaeva is a financial modeling consultant and the founder of Stavia Models. She has built financial models for SaaS, AI, marketplace, and other startup business models, helping founders plan pricing, growth, fundraising, and unit economics. Stavia Models is based on this hands-on consulting experience and turns that modeling logic into a guided product.