How to Read a Startup Financial Model After You Build It
Learn how to read P&L, Cash Flow, Unit Economics, and a detailed forecast view as connected lenses on the same startup — so the model helps you make decisions, not just produce numbers.
A startup model is more than one forecast view
Founders often feel the model is done once assumptions are entered. In practice, that is where the reading starts. Forecast views are not competing versions of the business. They are different perspectives on one shared engine fed by pricing, acquisition, costs, payroll, financing, and roadmap timing.
This matters because no single output tells the whole story. EBITDA can improve while cash still tightens. Per-customer economics can look attractive while company burn remains too heavy for the stage. Revenue can look smooth in a summary view while the monthly mechanics underneath are brittle. The value of the model appears when those signals are read together and reconciled.
Three classic financial lenses, plus one detailed forecast view
P&L, Cash Flow, and Unit Economics are familiar financial lenses. Each gives a legitimate but partial reading. P&L translates operations into income-statement structure. Cash Flow translates the same business into liquidity and runway pressure. Unit Economics translates growth into per-customer value and acquisition efficiency.
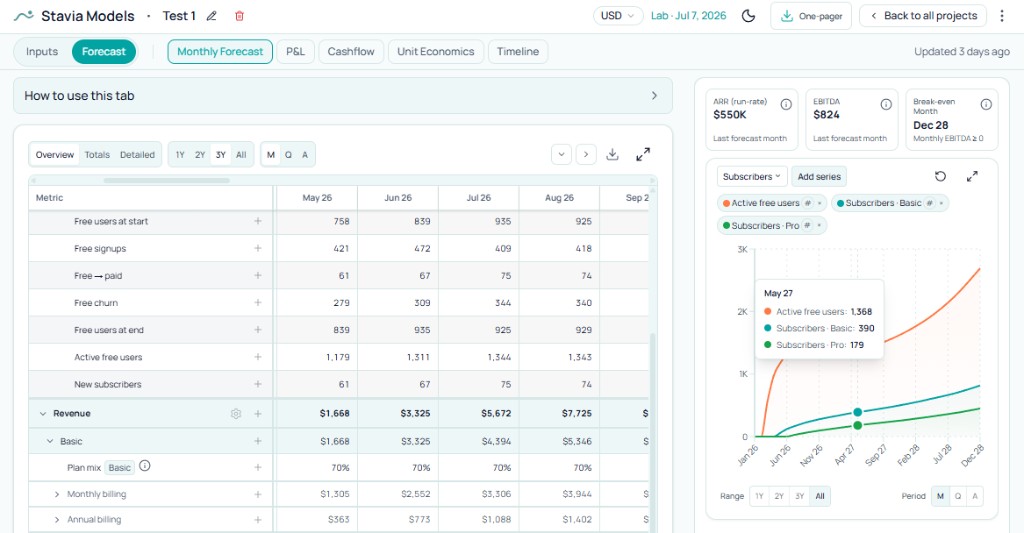
The detailed forecast view has a different job. It is the operational breakdown that explains where those summary outputs came from. In Stavia, that breakdown lives in the Monthly Forecast tab: volumes, conversion flow, pricing mix, COGS layers, team timing, overhead timing, and financing events by month.
That distinction is central to how this page should be read: three classic financial views help you interpret outcomes; the detailed forecast view helps you verify the mechanics producing them.
How to use the detailed forecast view to explain the numbers
This is the most diagnostic view in the forecast area. When revenue falls short, margin thins unexpectedly, or a cash dip arrives too early, this is where you trace causality instead of guessing. The monthly sequence makes it clear whether the issue is acquisition mix, subscriber movement, billing cadence, payroll step-ups, one-time cost timing, or delayed financing.
Startups usually do not break because an annual average is slightly off. They break when timing collides in a specific month. A detailed operational forecast catches those collisions earlier than summary-level outputs. It is the bridge between assumptions and interpretation.
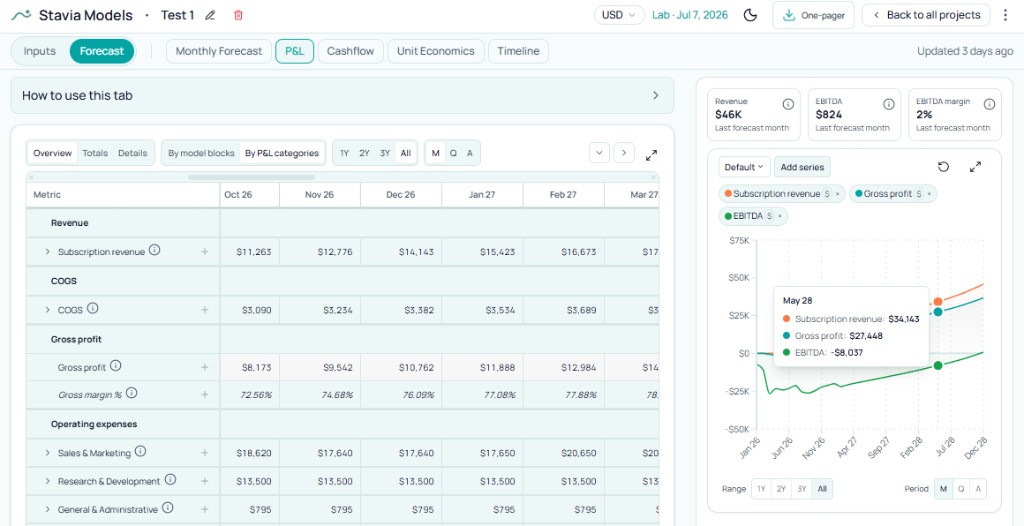
How to read P&L
P&L gives the business its most familiar shape: revenue, COGS, gross profit, operating expenses, and EBITDA. It is excellent for understanding structure, category concentration, and whether operating leverage is improving. It is also the cleanest lens for board and fundraising conversations because the vocabulary is shared.
Its limit is timing of cash survival. P&L answers profitability questions; it does not by itself confirm that liquidity stays safe during the same period. Treat it as a structural lens, then validate cash reality separately.
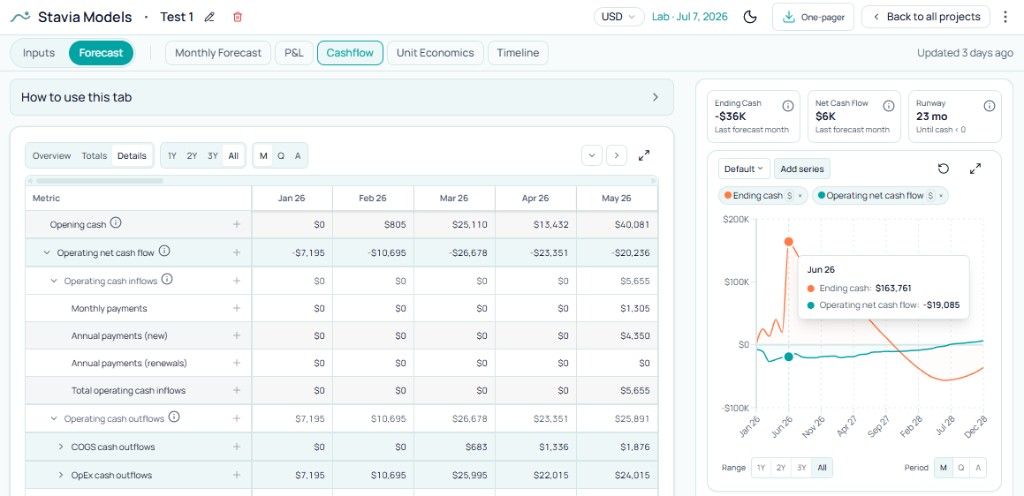
How to read Cash Flow
Cash Flow is the survival lens. It shows operating cash inflows, operating cash outflows, financing inflows, and ending cash over time. It is where runway becomes visible as a cash path staying positive or going negative, not as a detached formula.
This is also why teams can feel fine in P&L but still face operational risk: billing cadence, one-time items, and financing timing shift liquidity in ways a profitability view smooths over. Read this tab to answer when cash tightens, what drives the dip, and whether funding arrives in time.
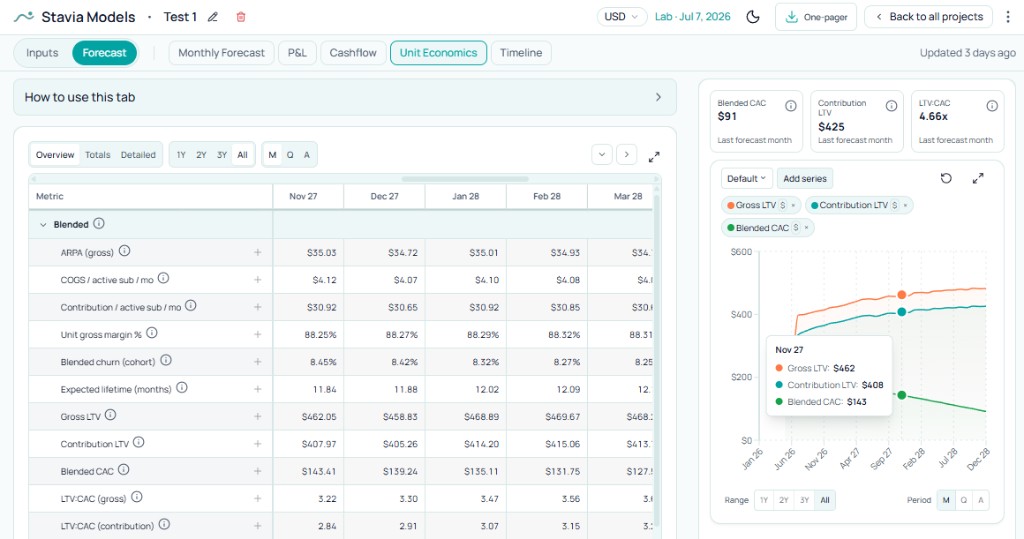
How to read Unit Economics
Unit Economics is narrower than company-level views, but often sharper for growth decisions. It clarifies ARPA, paid-serving COGS per subscriber, contribution, CAC, LTV-style logic, and payback behavior. This is where founders can judge whether incremental growth quality is strong enough for the acquisition effort behind it.
Treat it as a focused lens rather than a full verdict. Strong unit economics do not guarantee company survival if team, overhead, and financing timing are misaligned. It becomes powerful when read alongside cash and P&L, not in isolation.
Why bottom-up models are more useful for real startup decisions
Top-down exercises remain useful early for ambition framing and market sizing. They help teams ask what scale would matter if execution goes well. Once operating choices become concrete, bottom-up models become far more useful because they are event-driven: channel flow, conversion timing, pricing and churn, cost layers, hires by date, and financing by date.
That structure makes the model stress-testable. You can see whether pricing, hiring, acquisition, burn, and funding still hold together when assumptions move. It turns the model from aspiration arithmetic into a planning environment.
How to move from assumptions to interpretation in Stavia
A practical workflow starts with disciplined assumptions, then rotates across forecast views. Build the underlying model through pricing, acquisition, cost structure, cost of revenue, overhead, payroll, and financing.
Then read the same business through the detailed forecast view, P&L, Cash Flow, and Unit Economics. The goal is coherence: these inputs produce this operating path, this profitability shape, this cash trajectory, and these per-customer economics. When that story holds together across views, the model is ready to support decisions. If you are preparing for a raise, connect the same operating path to startup use of funds planning so allocation and milestone evidence match what the forecast already shows.
Common mistakes
Conclusion
A startup model becomes most valuable when it is read as a connected system. You can see how assumptions shape profitability, how timing shapes liquidity, and how growth economics behave at the customer level while still staying grounded in monthly operational mechanics.
That is how founders move from data entry to decision quality: several lenses, one coherent business story. Those lenses are part of a broader startup financial modeling guide that connects pricing, acquisition, costs, and runway in one forecast.
About the author

Anastasiia Nikolaeva
Founder of Stavia Models
Anastasiia Nikolaeva is a financial modeling consultant and the founder of Stavia Models. She has built financial models for SaaS, AI, marketplace, and other startup business models, helping founders plan pricing, growth, fundraising, and unit economics. Stavia Models is based on this hands-on consulting experience and turns that modeling logic into a guided product.